Practice Health
Your practice's key numbers, every billing report, reports you build yourself and alerts, in one place. Administrators see everything and decide who else sees each report.
Practice Health
Your practice's key numbers, every billing report, reports you build yourself and alerts, in one place. Administrators see everything and decide who else sees each report.
Practice Health: your key numbers, billing reports and alerts in one place
Practice Health brings your practice’s key numbers, every billing report, reports you build yourself and alerts into one workspace. Open it with the Practice Health button in the top toolbar (next to Refill Center) or from Admin → Practice Health. It opens as its own tab with four parts: Overview, Reports, Builder and Alerts.
Who sees what
| Person | What they see |
|---|---|
| Practice administrators and the practice owner | Every report and number, and they choose who else sees each report. |
| The practice owner | Also the time-with-patients reports (Time with patients by provider, Provider face time and the Face time per visit tile), which only the owner sees until the owner shares them. |
Everyone, when the owner chooses Kept to you | Nothing, administrators included, until the owner shares a report with them. Billing staff keep the billing reports, and people who manage Reputation Management keep the patient feedback reports (next rows). See Sharing a report. |
| Anyone who could run billing reports before (Run billing operational reports) | Still sees the billing reports, with the same numbers and filters as before, even when Practice Health is kept to the owner. |
| Anyone who manages Reputation Management | The Patient feedback & reviews reports and their Overview numbers, even when Practice Health is kept to the owner. See Patient feedback & reviews. |
| Everyone else | Only the reports an administrator shared with them, and the Overview numbers those reports back. |
| Someone with Hide practice financials on | No report or number about the practice’s money, even when it is shared with them. |
Not in your toolbar? Nothing has been shared with you yet. Ask a practice administrator, or the practice owner if your practice keeps Practice Health to the owner. You can also hide or move the button like any other: Customize in the toolbar.
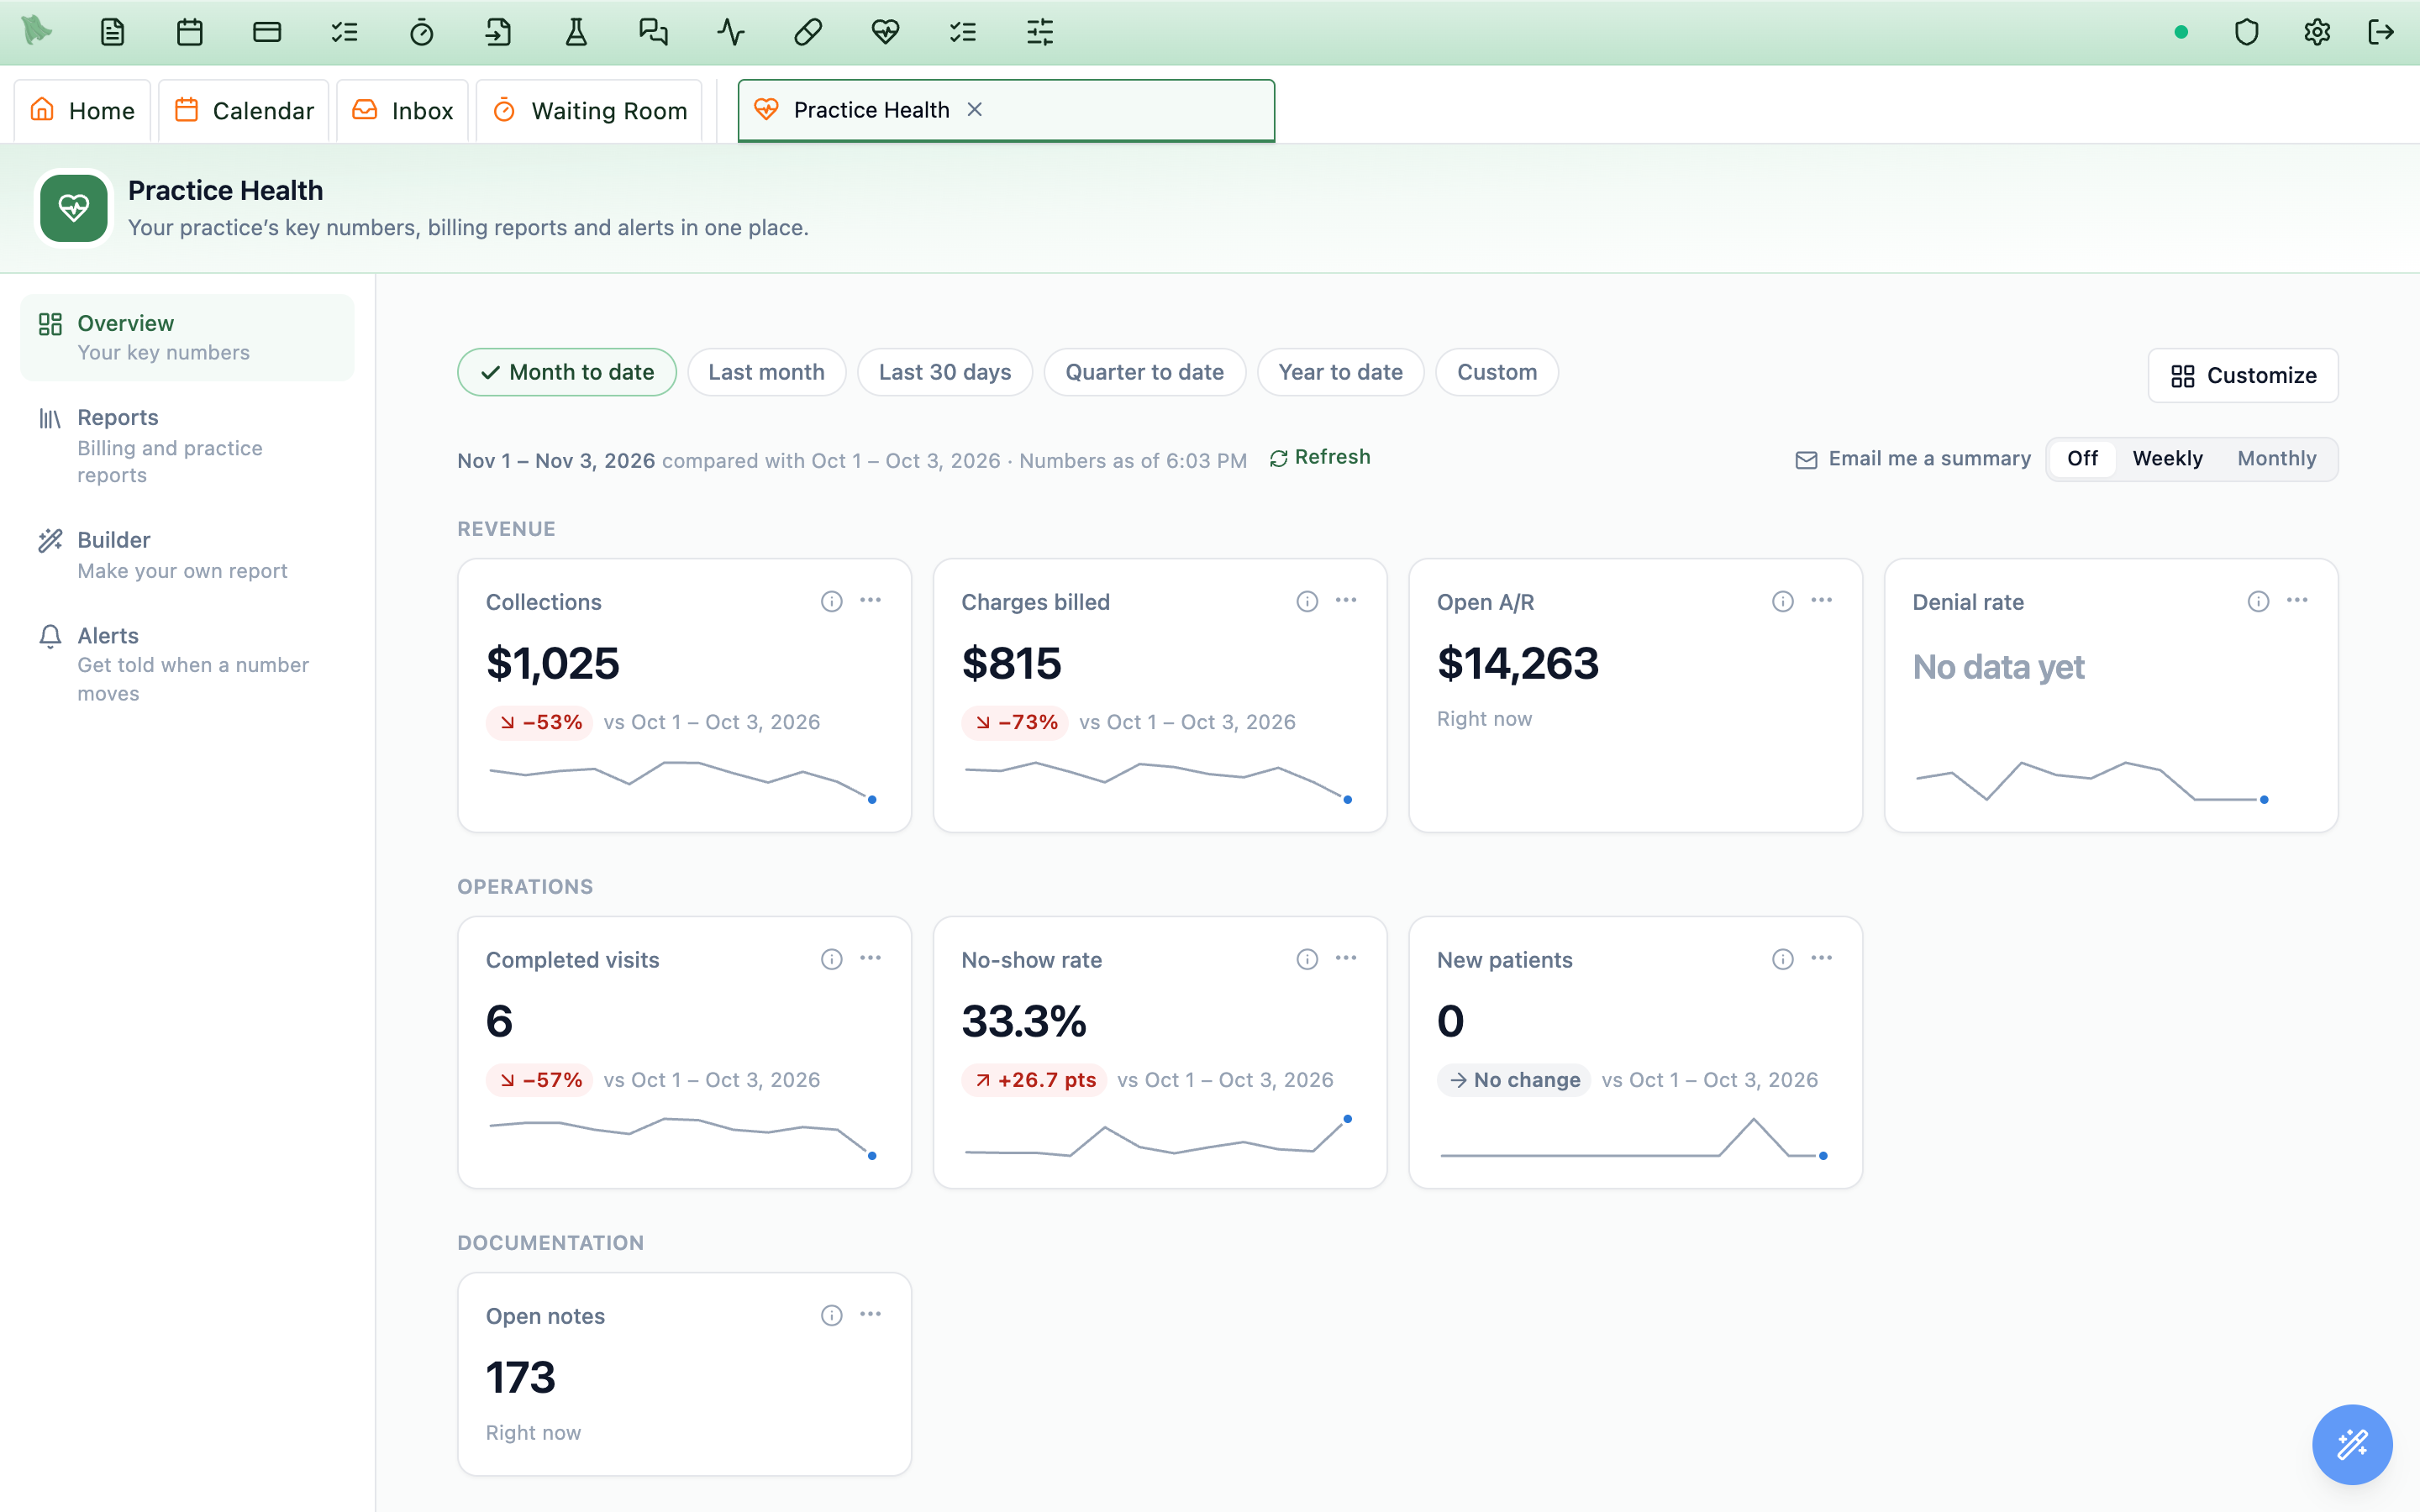
Reading the Overview
- Pick the period at the top:
Month to date,Last month,Last 30 days,Quarter to date,Year to dateorCustom. Every tile compares with the period just before it: month to date compares with the same days last month, and a whole month with the whole month before. - The change chip is green when the number moved the way you want (collections up, no-shows down) and red when it moved the other way. Percent numbers change in points.
- The
ⓘbutton says exactly what the number counts. Click the tile to open the report behind it. - “Right now” numbers (open A/R, open notes, open refill requests) are as of today, whatever period you pick, so they have no trend line.
- Goals. Administrators set a goal from a tile’s
…menu (for example no-show rate at most 8%). The tile then shows whether it is met. - Customize.
Customizelets you reorder, resize, add and remove tiles, including charts you pinned from a report. Your layout is yours; administrators can alsoSave as practice defaultfor everyone who has not customized theirs, and anyone canReset to practice default. - Email me a summary. Choose
Weekly(Monday morning) orMonthly(the 1st) to get the Overview numbers you can see by email. The email holds numbers only, never patient names.
Numbers refresh every few minutes; Refresh fetches them now.
The report library
Open Reports. Each card shows the report’s name, what it shows and its category (Revenue, Claims & denials, Patient balances, Billing checks, Scheduling, Documentation, Staff time, Refills, Patient feedback & reviews, Custom reports).
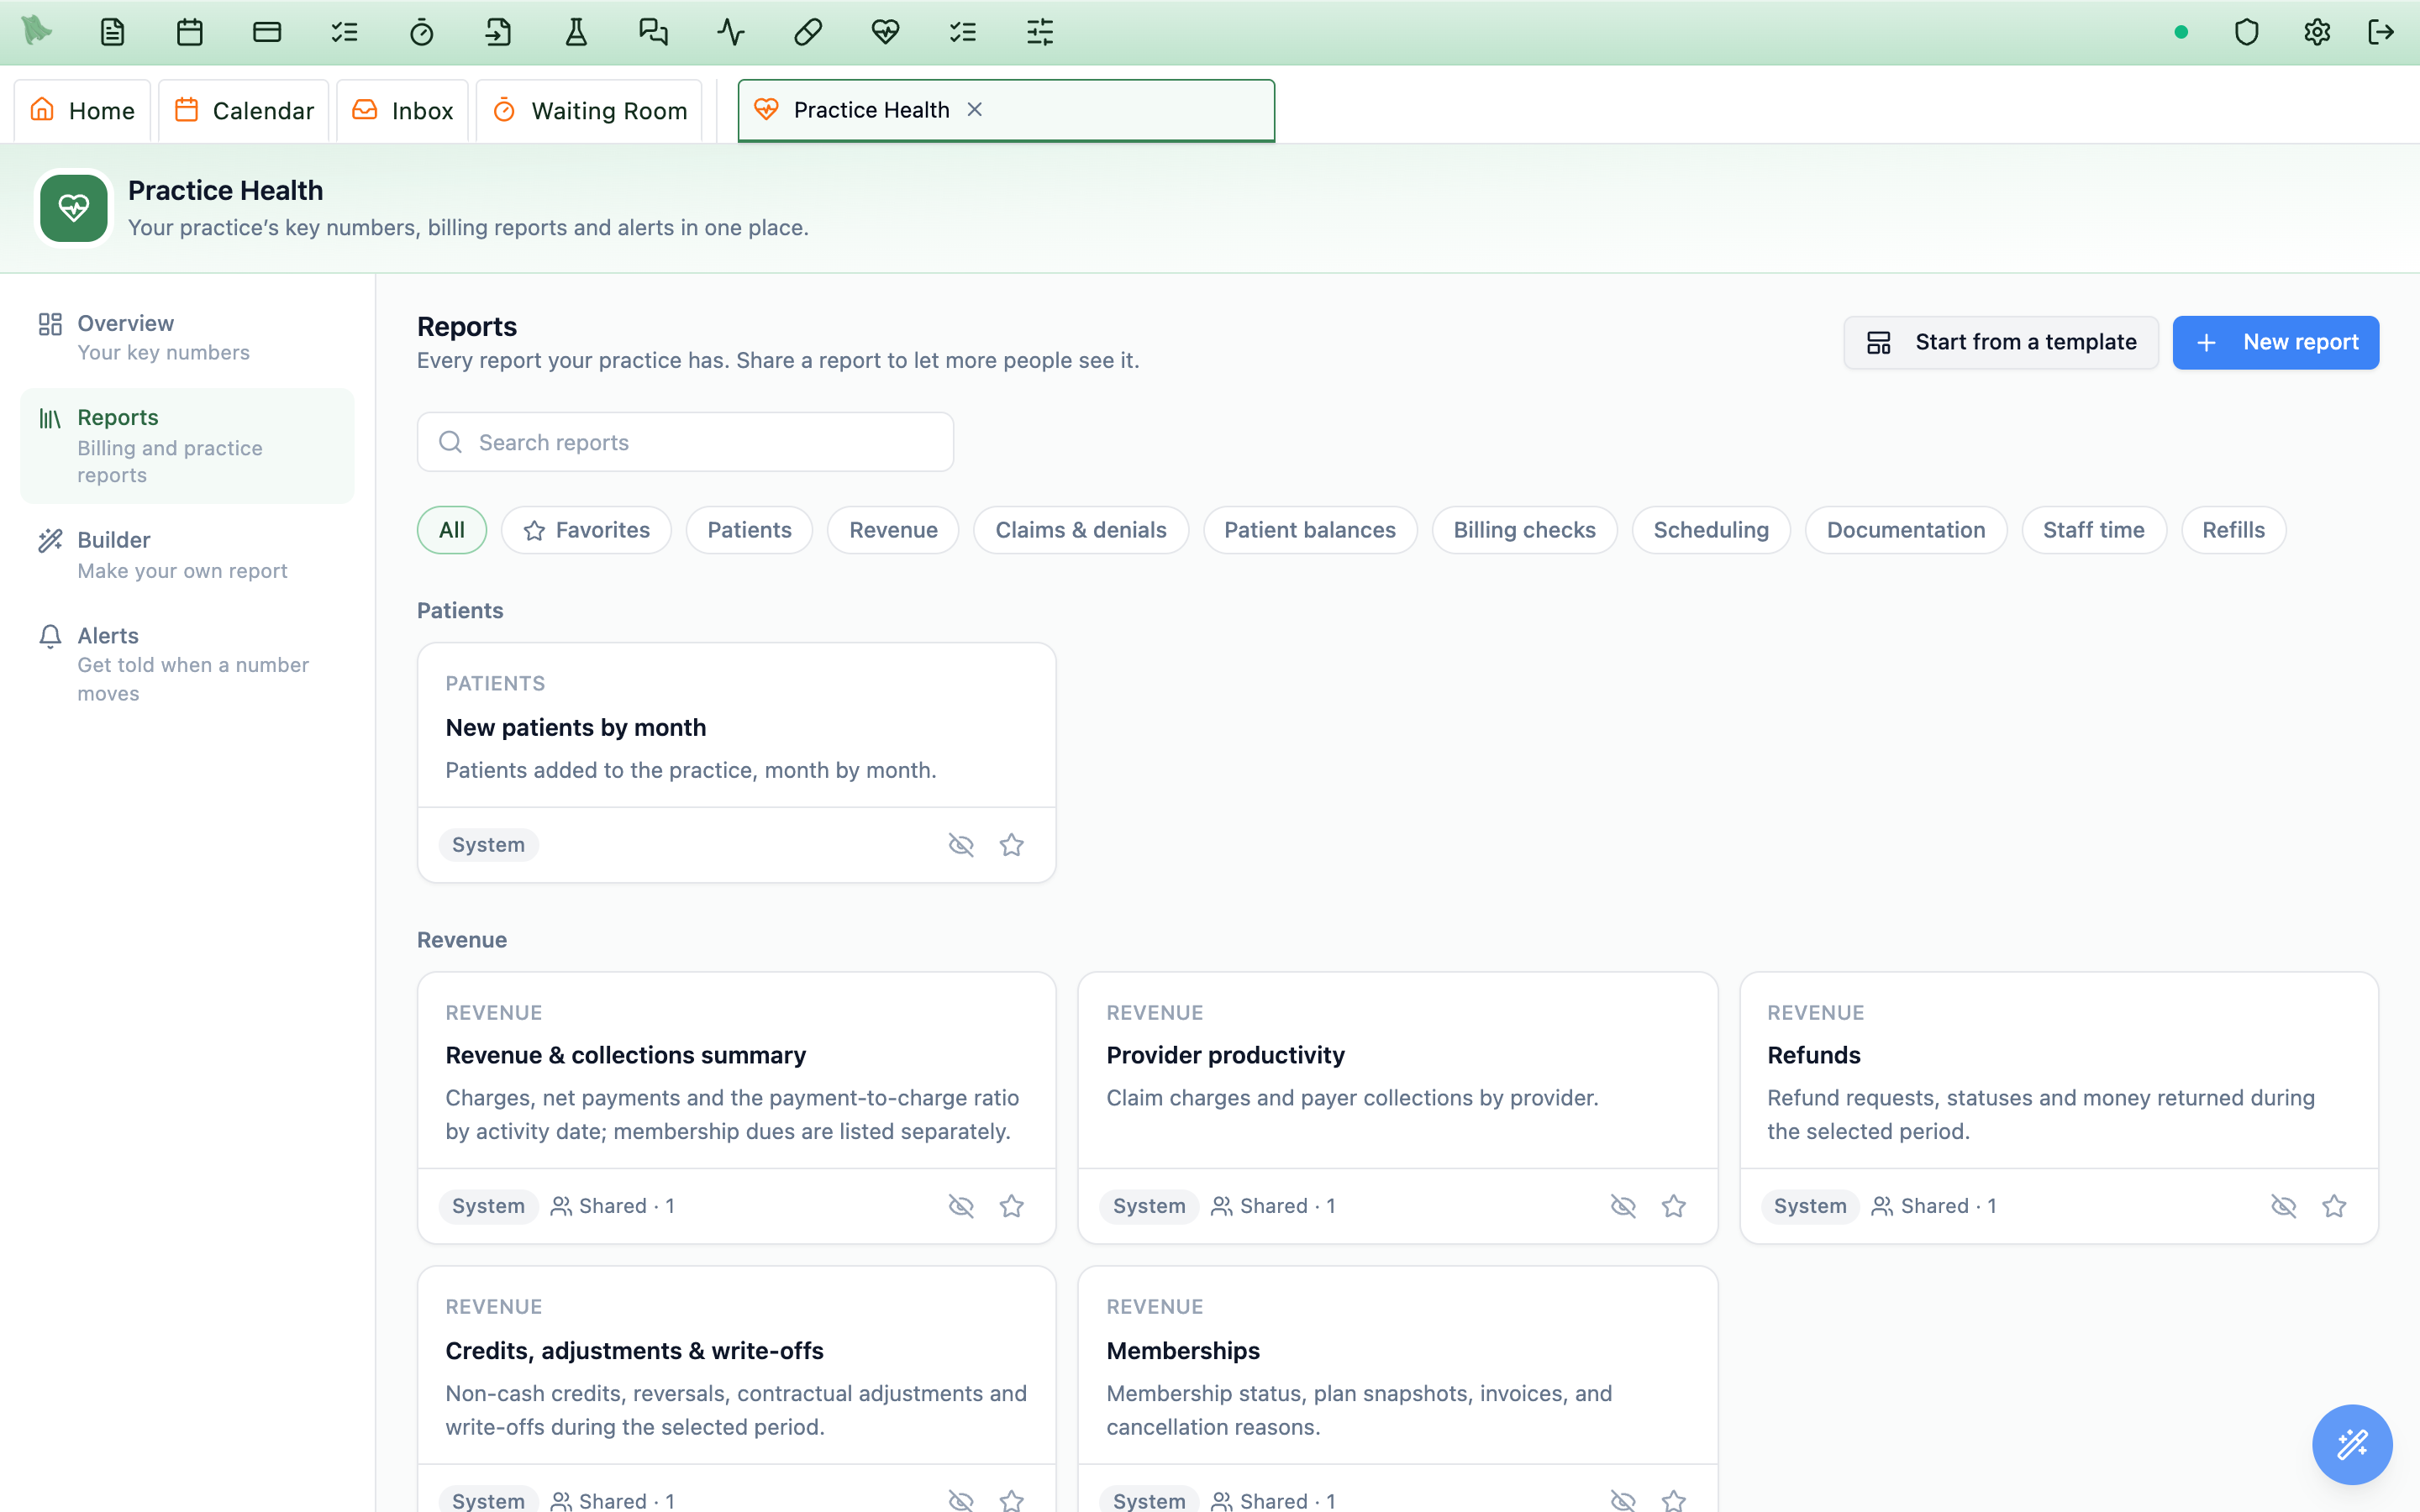
- Search looks in report names and descriptions. Favorites shows the reports you starred.
- System reports come with Hero; Custom reports were built by someone in your practice (the card says who).
- Administrators see
Shared · 3(how many people or permissions a report is shared with) and a bell when a report has an alert. They can hide a report the practice never uses (the eye button) and find it again withShow hidden reports. - People who can build reports see
New reportandStart from a template.
Running and exporting a report
- Open a card. The report runs straight away for its usual dates. There is no Generate button: it runs again each time you change a date or a filter.
- Change the dates and filters. Pick a preset or custom dates, and filters such as provider, payer, location, department or legal entity. Under the dates you see exactly which days it covered, in your practice’s calendar.
- Break down by (some reports only). Reports that offer it show
Break down bychoices under the dates and filters, for example provider, visit type or location. Pick one to regroup the same report; your dates and filters stay. - Read
How this is measuredfor what each number counts. - Sort and open. Click a column heading to sort; click a patient’s name to open the chart in a new tab.
- Export.
Exportdownloads the report as CSV, Excel or PDF with the dates and filters on screen. Downloads of reports that list patients are recorded in the audit log.
Chart reports also have Pin to Overview. Custom reports have Edit (for the person who built it and administrators) and Duplicate, which makes a copy you can change.
If a report says it isn’t shared with you, or that practice financials are hidden for you, ask a practice administrator. If a report is too large, choose fewer days or add a filter.
Billing checks: visits that may be charged twice, and money that was undone
Insured visits with a patient visit fee
Lists visits that were billed to insurance and still carry a cash visit fee for the patient (the visit type’s price added at booking, check-in, after the visit, or when the visit was marked Cash pay). The patient may be asked to pay twice: once through their insurance share and once for the cash fee.
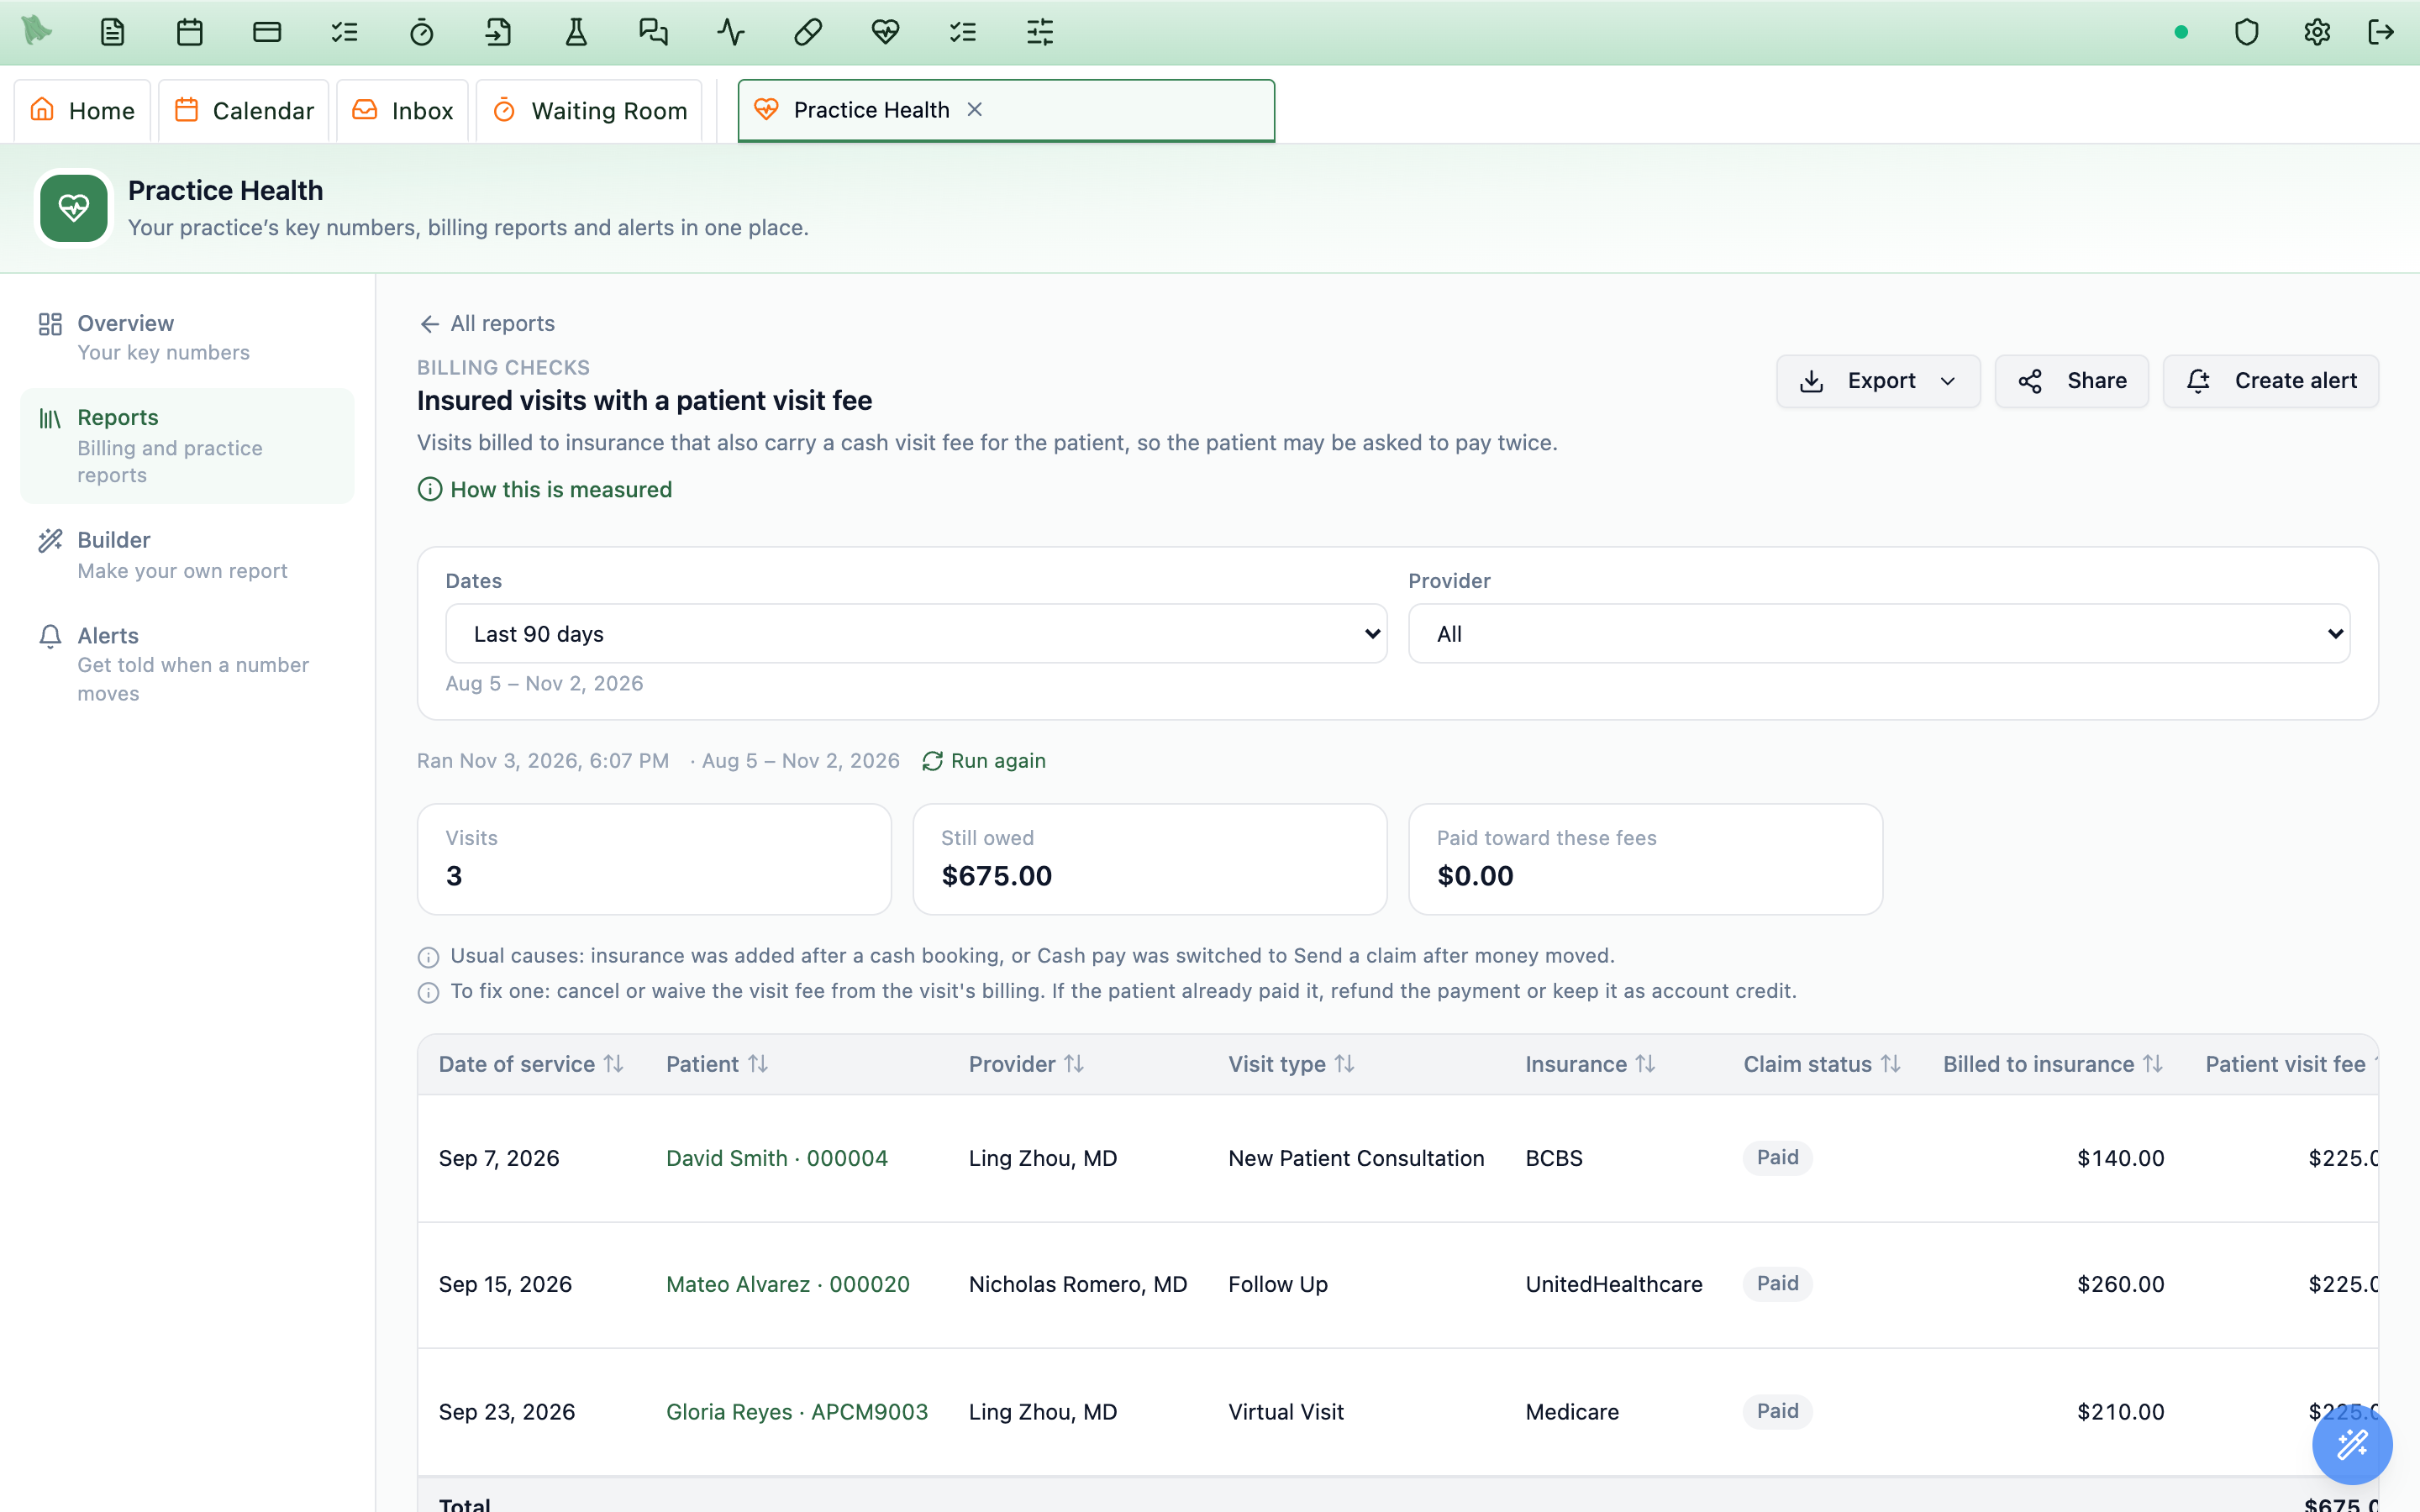
- Usual causes: the visit was booked as cash pay and insurance was added later, or the visit was switched from Cash pay to Send a claim after money had moved.
- To fix one: open the patient’s billing for that visit and cancel or waive the visit fee. If the patient already paid it, refund the payment or keep it as account credit.
- Copays, coinsurance, deductibles and deposits are not listed: those are the patient’s share of the insurance claim.
- The
Insured visits with a patient visit feenumber on the Overview counts the last 90 days, so a new one stands out.
Reversals, voids & write-offs
One timeline of money that was undone: cancelled or waived charges, copays removed, duplicate charges removed, voided manual charges, reversed payments and credits, patient and bad-debt write-offs, staff claim write-offs, claim voids and replacements, and visits marked entered in error. Each row shows when, what happened, the patient, the visit date, the amount, who did it and their reason. Filter by type or staff member. The older Credits, adjustments & write-offs report is unchanged.
A test or demo visit on a real patient? Mark the visit entered in error from the note (it voids the note, voids any claim that can be rebuilt and retires its charges), then check it here.
Sharing a report
Administrators share reports; the practice owner shares the time-with-patients reports. Open the report and click Share.
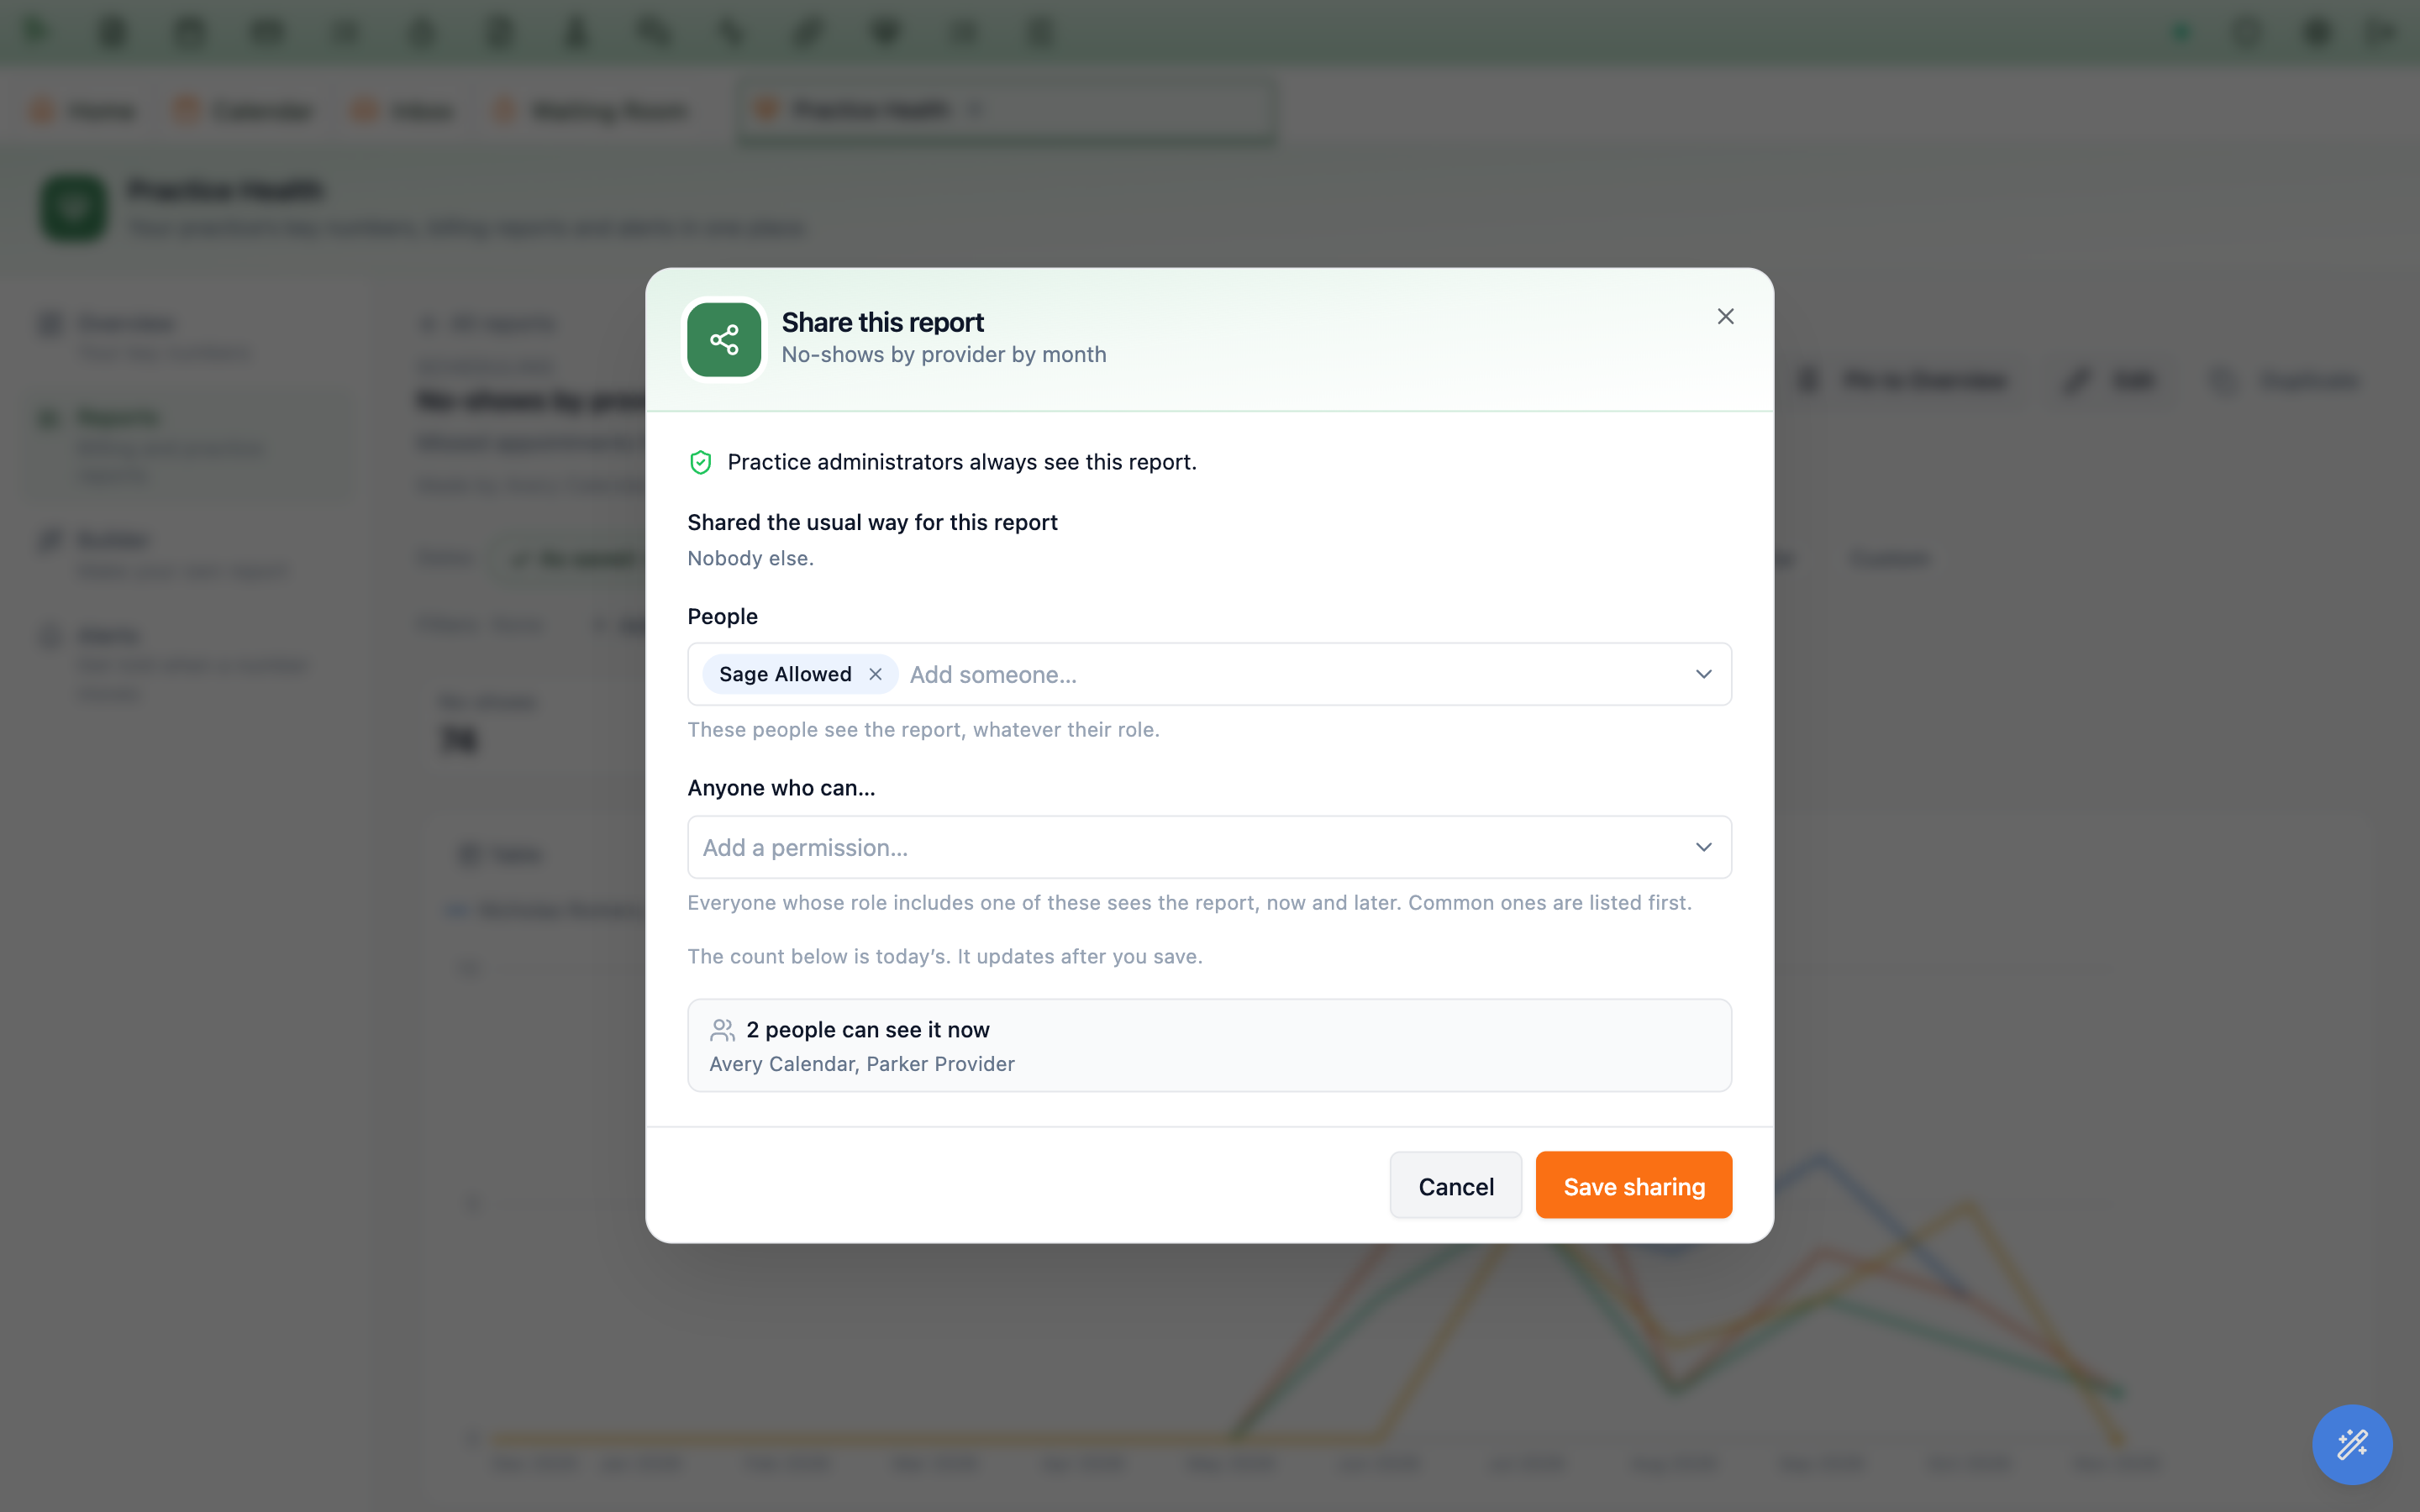
- People: add named staff members. They see the report whatever their role.
- Anyone who can…: add a permission, for example Run billing operational reports. Everyone whose role includes it sees the report, including people who get that role later.
- Check the box at the bottom: how many people can see the report and who they are.
- Click
Save sharing.Reset to defaultgoes back to the way Hero shares that report.
Anyone else can click Who can see this. Sharing a report never shows money to someone whose practice financials are hidden.
Keeping Practice Health to the owner
The practice owner can keep Practice Health to themselves. Click the button at the top right of Practice Health (Administrators can open), choose Only you, and the people you share with and Save. The button then reads Kept to you.
- Administrators and other staff no longer open Practice Health.
- Billing staff who could run billing reports before (Run billing operational reports) keep the billing reports, and the Overview numbers those reports back, and nothing else. The owner can change who sees each billing report from its
Sharebutton. - The owner shares any report from its
Sharebutton, with named people or with everyone who has a permission. Only those people see it. - People who manage Reputation Management keep the
Patient feedback & reviewsreports. The owner can change who sees each of them from itsSharebutton. - Only the owner builds reports, sets goals and alerts, and changes sharing. Hero support can still look when they help your practice.
- To open Practice Health to administrators again, choose
Administrators and the people you share with. Only the owner sees the button.
Building your own report
Administrators can build reports, and so can anyone given the Build your own Practice Health reports permission. A builder only sees the data their own permissions allow. Open Builder, then Start from scratch or a template such as No-shows by provider by month or Collections by payer by month.
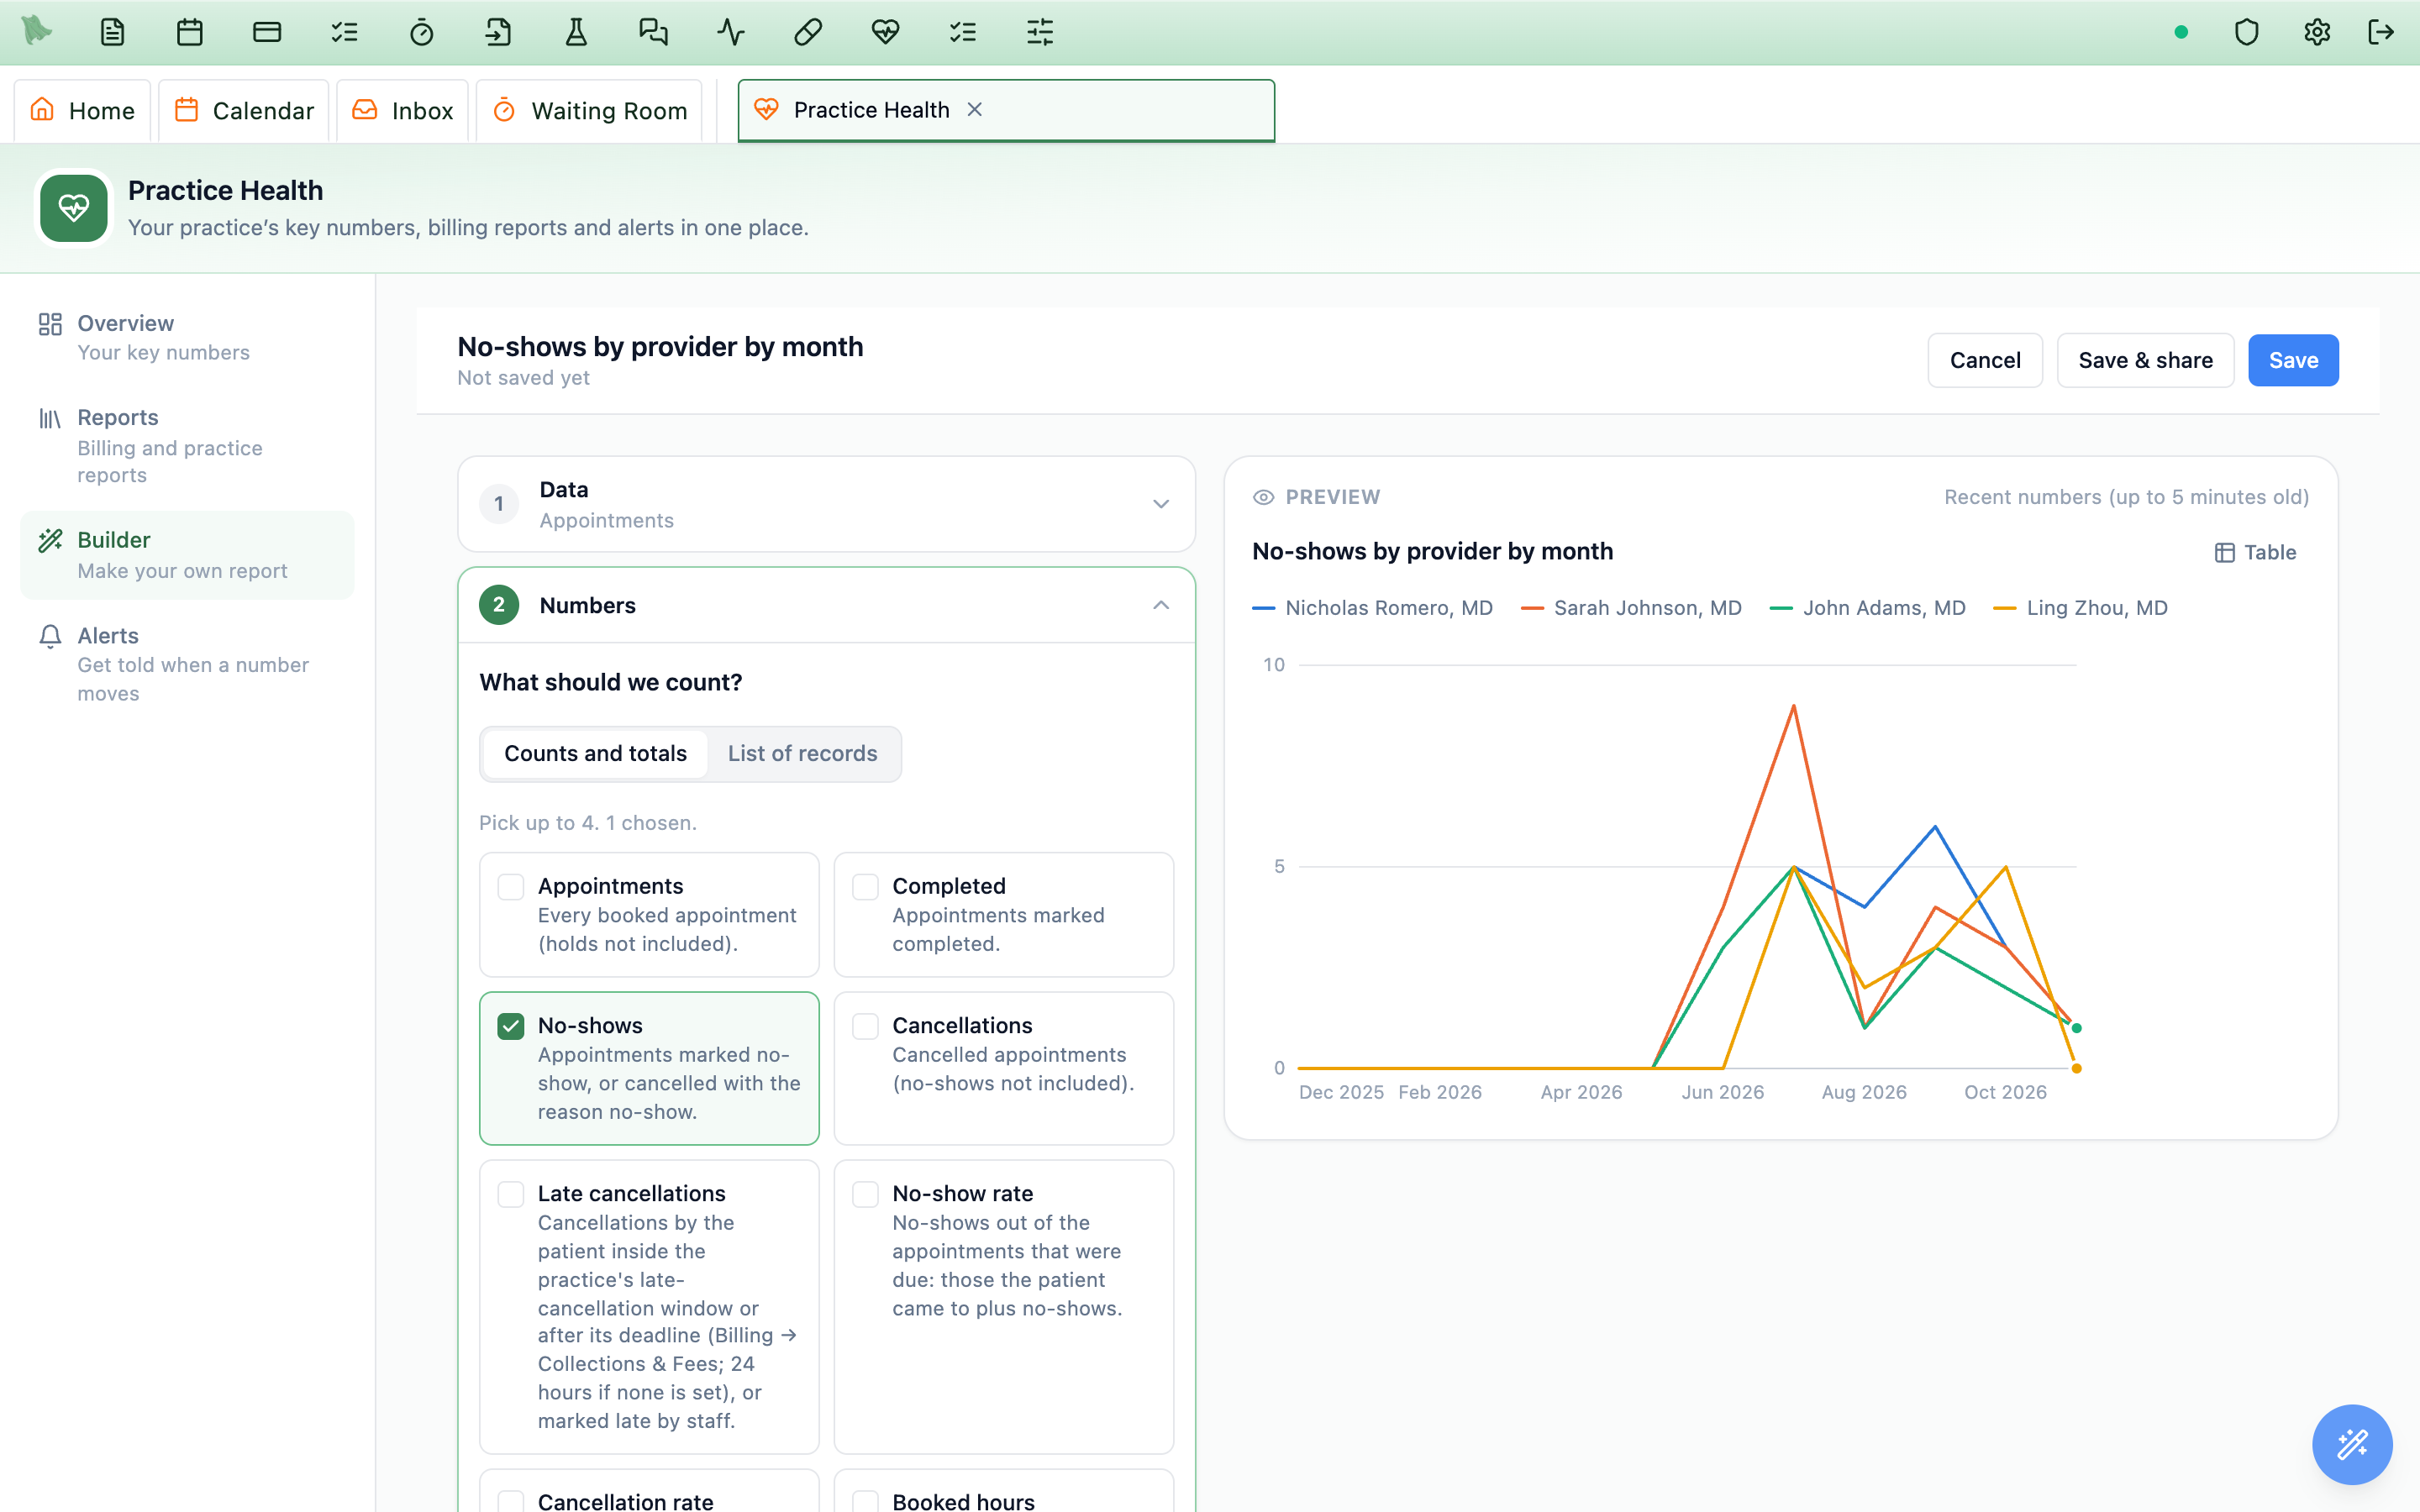
- Data: what to report on: Appointments, Visit notes, Time with patients (the practice owner only), Patients, Refill requests, Charges, Payments, Claims, Denials, Billing activity or Eligibility checks, and, for people who manage Reputation Management, Patient feedback and Sent to review sites.
- Numbers: up to eight things to count (appointments, no-show rate, amount collected…), or
List of recordsto list rows instead. - Time and breakdown: the date to use, the period, and how to break it down: by day, week, month, quarter or year, and by up to two things such as provider and payer.
- Filters: only include what you need (for example visit type is New patient).
- Chart: only charts that fit what you chose can be picked. Add a comparison with the previous period or year, and a goal.
- Details: name, description and category, then
Save.
A saved report is yours and your administrators’ until it is shared. People you share it with can change the dates and add filters, but they cannot remove the filters you saved: those decide what the report covers.
Reading a chart
- Hover or tab to a point or bar to see its numbers;
Tableshows the same numbers as a table. - Click a bar, point or slice to narrow the report to it; the breadcrumb above the chart steps back.
- Lines that would mix different units (a count and a rate) are drawn as two charts.
Alerts: be told when a number crosses a line
An alert tells chosen people when a number crosses a line, for example No-show rate above 8% over the last 7 days. Hero checks daily alerts every morning after 7:00 practice time, and weekly alerts on Monday mornings.
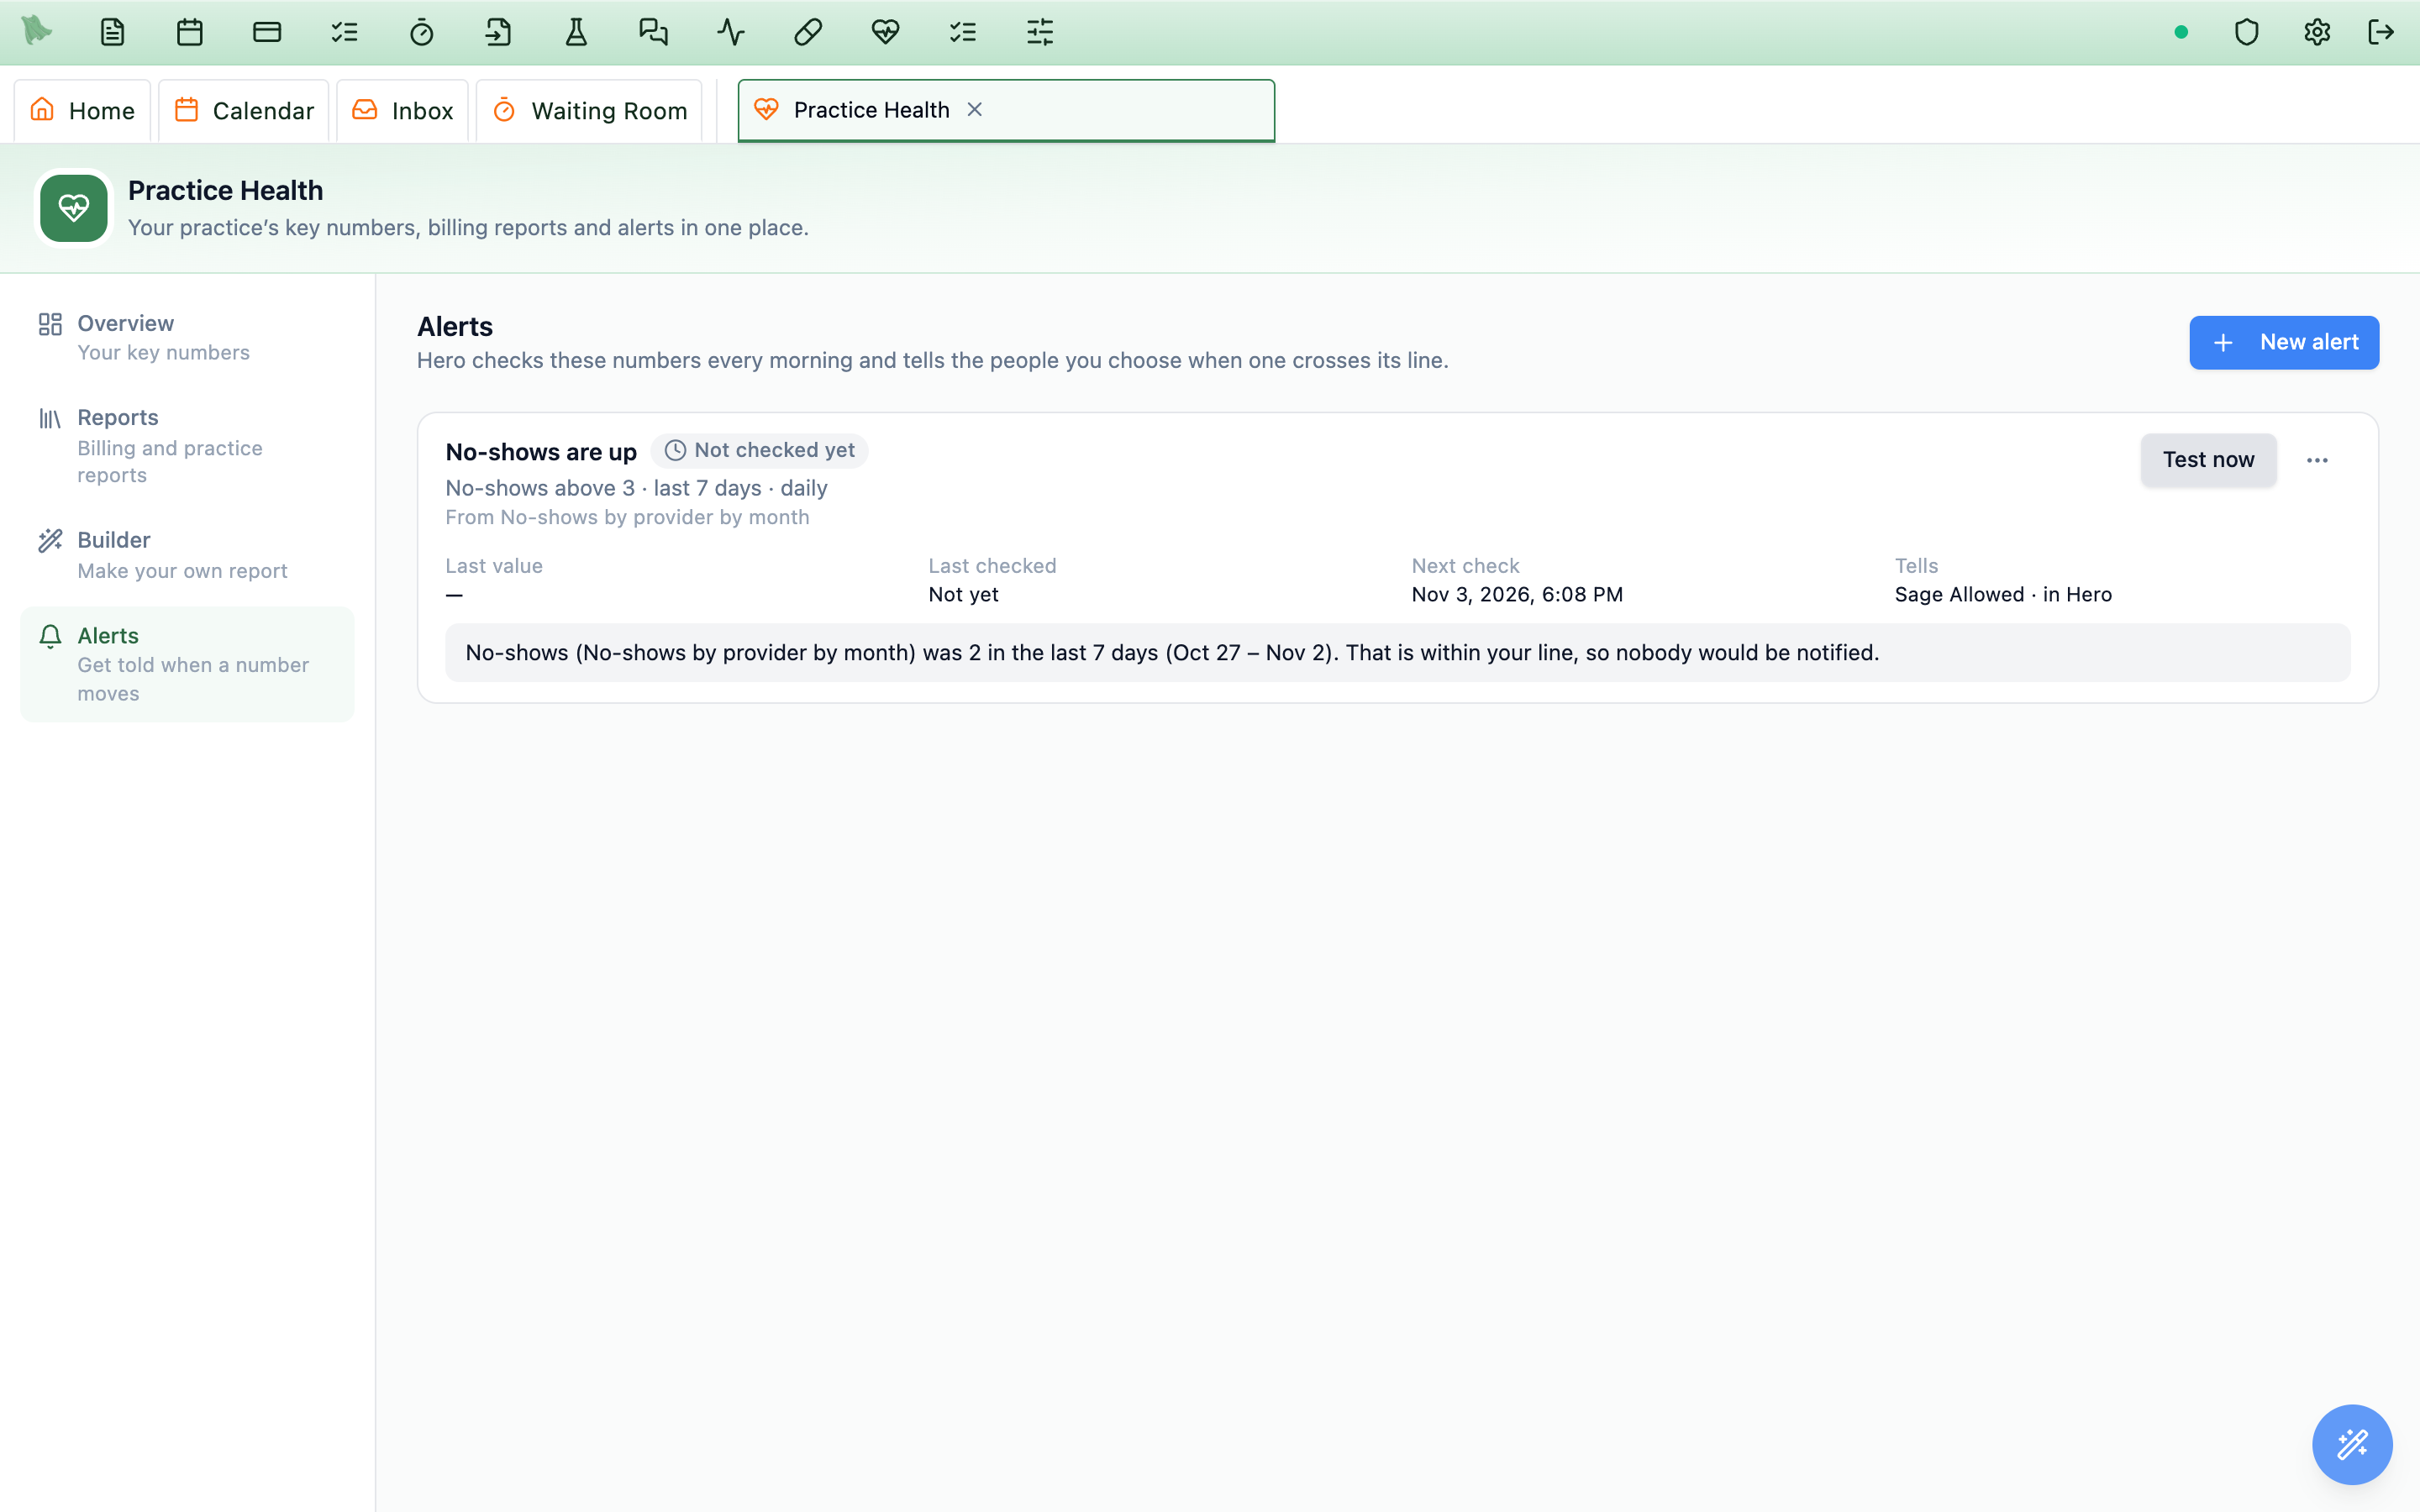
Test now checks the number straight away and says whether it would go off, without telling anyone.- Open
Alerts→New alert, orCreate alerton a report. - Choose what to watch: a Practice Health number, or a number from a chart report.
- Choose the period (yesterday, last 7 days, last 30 days, month to date or last month) and when to tell people: above or below a value, or up or down by more than a percent compared with the period just before.
- Choose who to tell (they must be able to see what the alert watches) and how:
In Hero(Inbox → Notifications),Email(numbers only), or both.
The list shows each alert’s state (Went off, Within range, No data yet, Snoozed, Off), its last value and when it is checked next. From the … menu you can change it, snooze it for a day, a week or until you turn it back on, see its history, or delete it.
Time with patients: how long providers spend with each patient
Practice Health shows how much time each provider spends with patients, how quickly charts are closed, and visits billed for more time than was recorded. It is the practice owner’s by default: nobody else, administrators included, sees it until the owner shares it.
Where to find it
- Overview: the
Face time per visittile (average minutes with the patient per visit) is on the owner’s Overview.Time flagscan be added fromCustomize. Click a tile to open the report behind it. - Reports → Staff time →
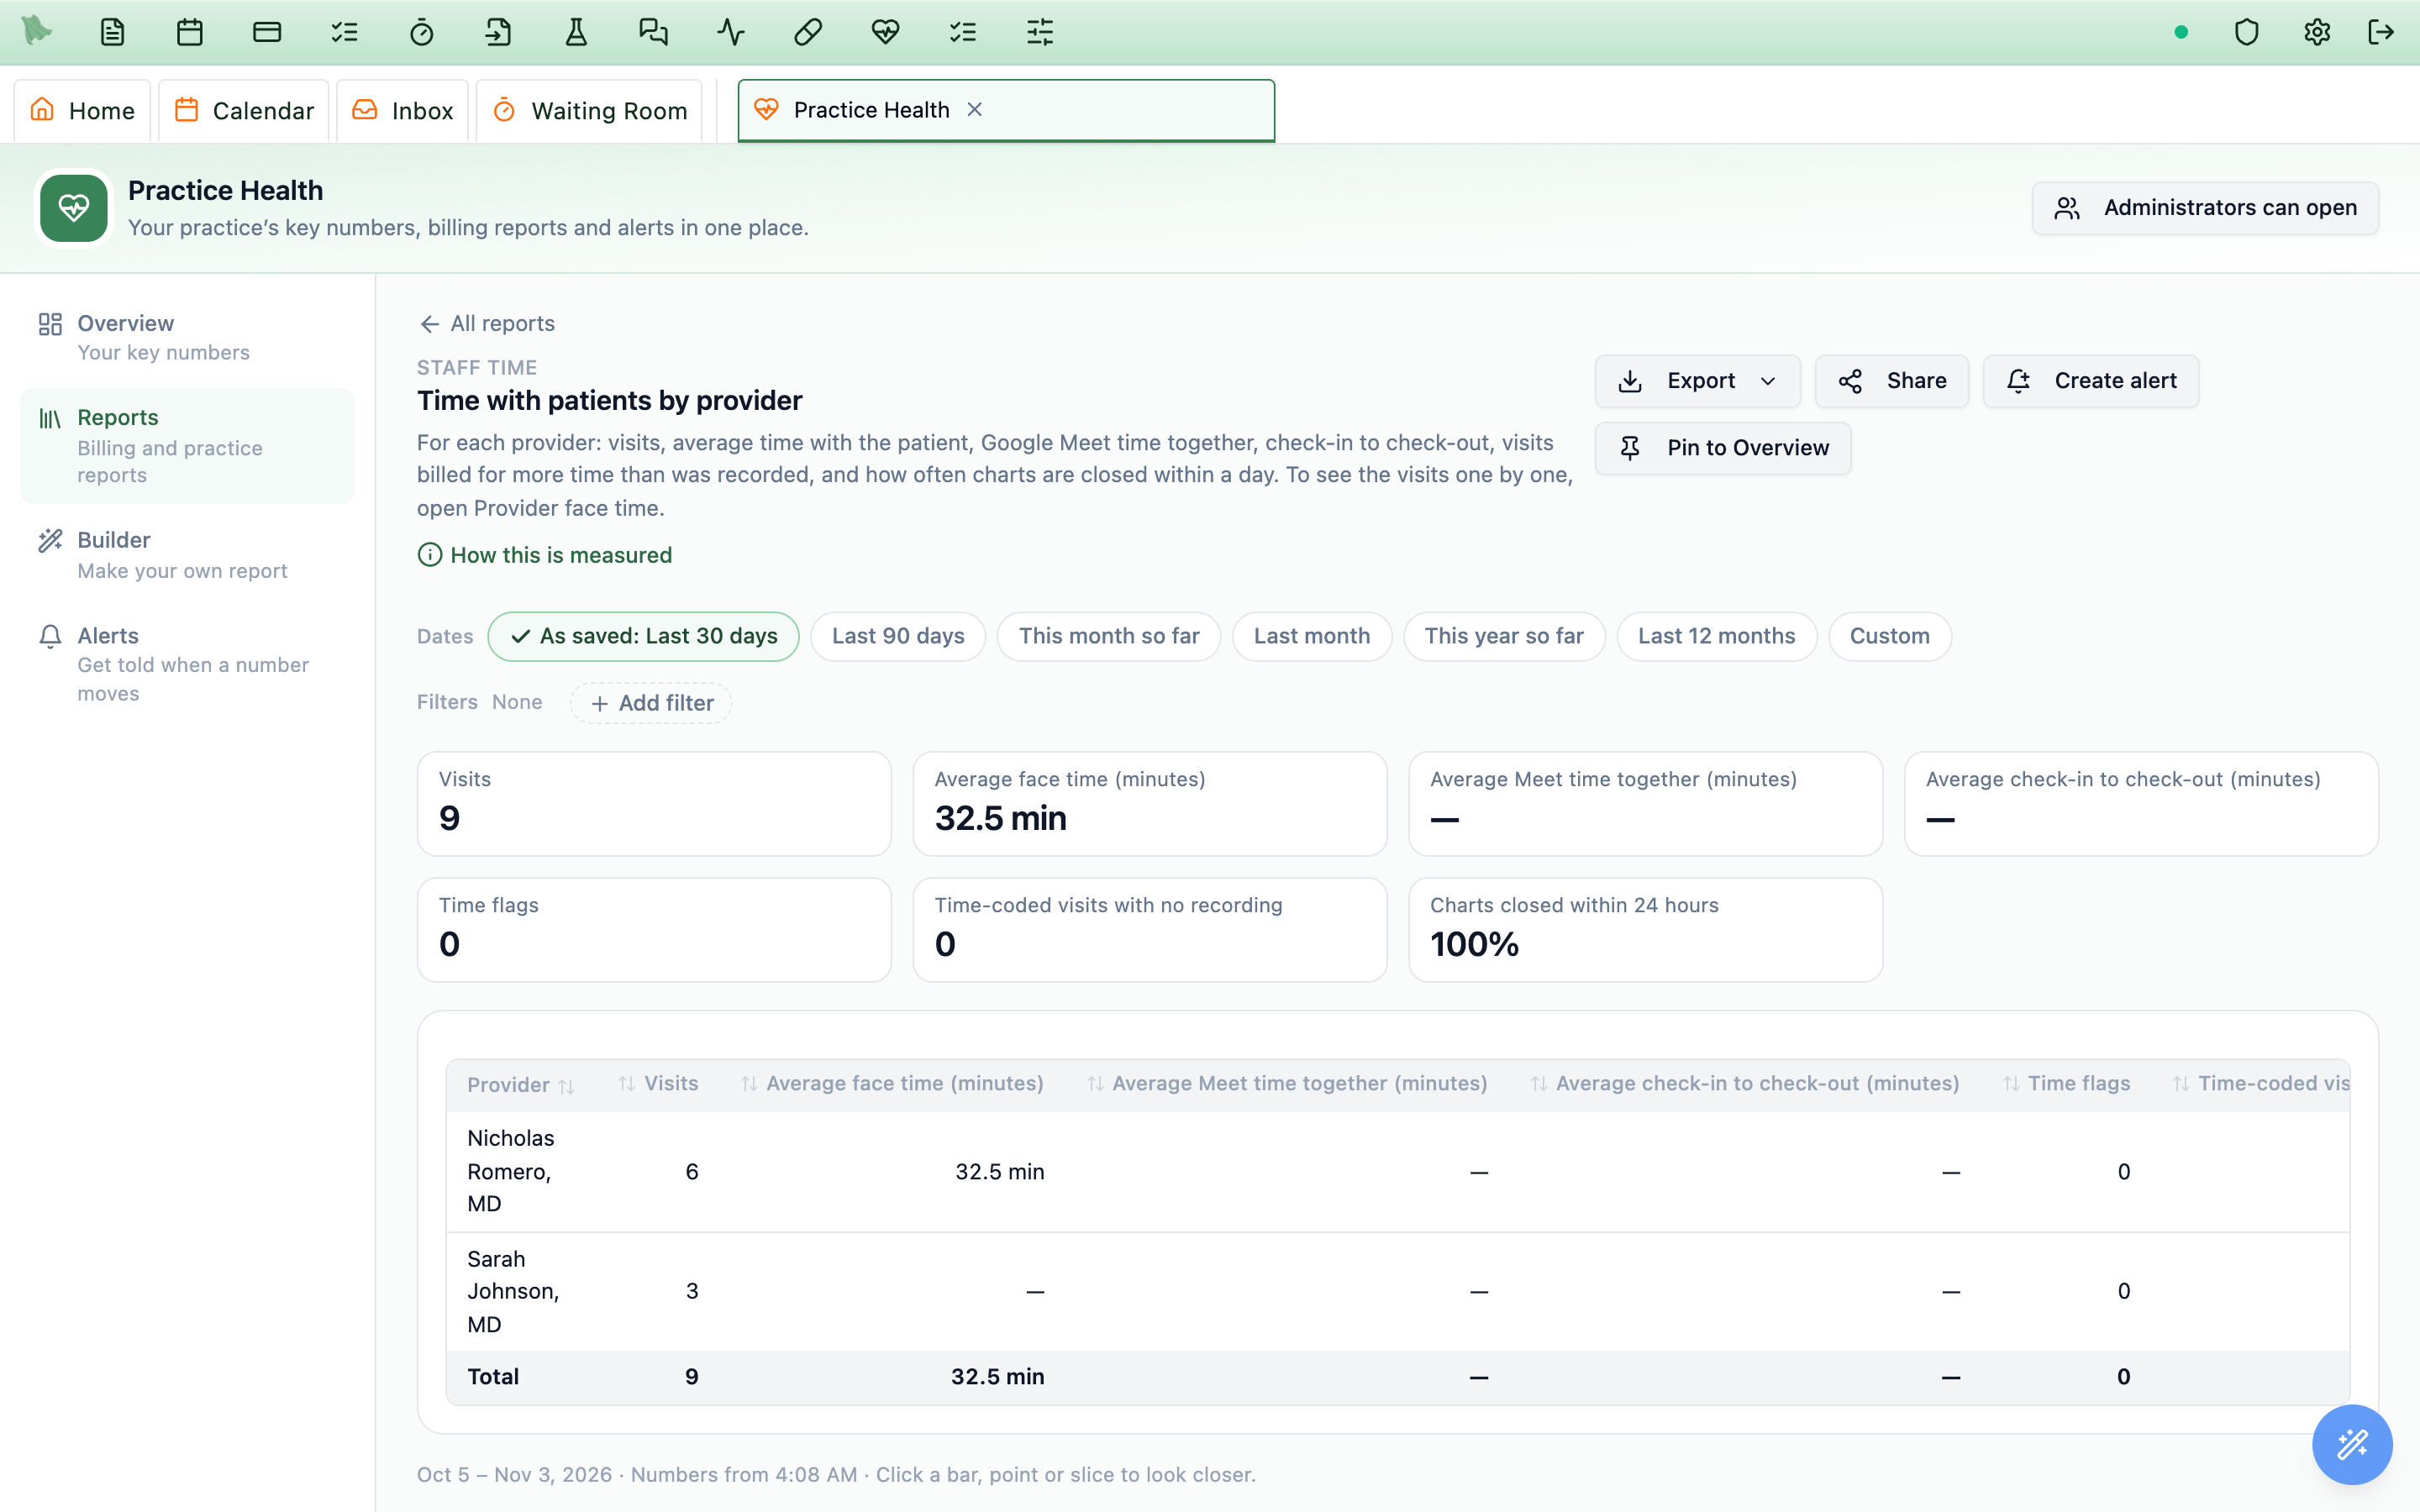
Time with patients by provider: visits, average face time, average Google Meet time together, average check-in to check-out, time flags, time-coded visits with no recording, and the share of charts closed within 24 hours, for each provider. You can chart it, set an alert on any of its numbers and pin it to the Overview. - Reports → Staff time →
Provider face time: every visit one by one, with the billed codes, the time check, phone talk time and a spreadsheet download. - Builder: the
Time with patientsdata lets the owner build their own reports, for example face time by week or by visit setting. Starting points: Face time per visit by provider by week, Time flags by provider and Face time by setting.
How it is measured
- Face time: the Google Meet time with the provider and the patient both on the call, or the ambient recording time, whichever is longer.
- Meet time together: minutes with both people on the call, for video visits Google Meet has records of. Zoom visits have none.
- Check-in to check-out: from check-in to check-out at the front desk (left out when longer than 12 hours).
- Hours to close: from the scheduled end of the visit to the note being signed or completed.
- Time flags: closed charts billed with time-based codes (psychotherapy 90832–90838, crisis 90839/90840, prolonged 99417/G2212) that need more minutes than were recorded. Prolonged codes count the whole day’s time, including charting, so a flag is worth a look rather than an error. Office visits (E/M) can be billed on medical decision making and are never flagged.
- No recording: closed charts billed with time-based codes that have no Meet or ambient time at all.
- Visits are counted by visit date in your practice’s time zone. Cancelled visits, no-shows and deleted visits are left out; a note still being written counts once the patient was seen or the visit has a recording.
Sharing and alerts
- Only the owner shares these reports. Sharing
Time with patients by provideralso shows that person theFace time per visitandTime flagstiles; it does not share the visit-by-visit list. - The owner can set alerts on Face time per visit, Time flags or any number in
Time with patients by provider, for example Time flags above 0, daily. Alerts go only to people who can see the report. - Weekly or monthly summary emails include Face time per visit and Time flags only for people who can see them.
Patient feedback & reviews: how your post-visit surveys are going
When your practice uses patient feedback (Admin → Reputation Management), Hero sends patients a short survey after their visit. Happy patients can be offered links to your Google, Yelp or other review pages, and low scores come to your team first so you can follow up (see Reputation & patient feedback). Practice Health shows how it’s going.
Who sees it
Practice administrators (only the owner, if your practice keeps Practice Health to the owner) and anyone who manages Reputation Management. Like any report, the owner or an administrator can share these with others (see Sharing a report).
The reports
Open Reports and pick the Patient feedback & reviews category.
| Report | What it shows |
|---|---|
Patient feedback by provider, Patient feedback by visit type, Patient feedback by location | For each provider, visit type or office: surveys sent, responses and the response rate; the average score (0–10) and % positive; low scores, and how many are still open; and how many patients went on to a review site. |
Patient feedback over time | Responses and the average score, week by week. |
Patients sent to review sites | How many patients tapped your Google, Yelp or other review links, by site. |
Low scores to follow up | Every low score with the patient, provider, visit and whether someone has followed up. Click a patient to open the alert in Reputation Management. |
- Break down by. The three
Patient feedback by …tables andPatients sent to review siteshaveBreak down bychoices under the dates and filters: provider, visit type or location. Your dates and filters stay, so you can pick one provider and then see their feedback by visit type. - Sort. Click any column heading to sort.
- Reputation settings. If you manage Reputation Management, each patient feedback report has a
Reputation settingslink in its header, next toHow this is measured. - Build your own.
Reports→Start from a templateoffers Feedback by provider, Review sites by provider and Low scores by visit type. InBuilder, choose thePatient feedbackorSent to review sitesdata (see Building your own report).
What the numbers mean
- Surveys sent counts surveys that actually went out, by the day they were sent in your practice’s time zone. Surveys that couldn’t be sent (no email or mobile number, the patient opted out, surveyed recently) aren’t counted.
- Positive and low score use your survey’s own thresholds: 9–10 and 0–6 unless you changed them.
- Sent to a review site means the patient tapped one of your review links on the survey’s thank-you page. A patient counts once however many times they tap. Hero can’t see whether they then posted a review.
- Pass-through rate is patients sent to a review site out of patients who were shown your review links.
- Comments patients write, and their answers to each question, stay in Reputation Management; Practice Health shows only the overall score.
On the Overview
Once your practice uses patient feedback, the Overview adds a Patient feedback section with Patient feedback score (the average score) and Sent to review sites (patients). Add Low scores open from Customize; it is a “right now” number, as of today whatever period you pick. Click a tile to open its report: the score and low scores open Patient feedback by provider, and sent to review sites opens Patients sent to review sites.
Not turned on yet? Reports shows a Patient feedback & reviews card, and the Overview shows one under the tiles (Not now hides it there). If you manage Reputation Management, choose Set up patient feedback to open Admin → Reputation Management; otherwise, ask your practice owner to turn it on. If your practice turns patient feedback off later, the reports stay, with the surveys already sent.
Where Billing → Reports went
- The quick reports that were under
Admin → Billing → Reportsare now inPractice Health → Reports, with the same numbers, filters and downloads. Denial trends and CPT payment analysis are there too. Old links to Billing → Reports open Practice Health. Admin → Reports(Provider face time) moved into Practice Health as well:Reports → Staff time, next toTime with patients by provider.- The
Provider Payoutson/off switch is now inBilling → Payment Model; the report itself is in Practice Health.
Need help? Email support@heroemr.com.